5 minute read Car Sharing Guides Lifestyle
Key sporting events you won’t want to miss in 2025
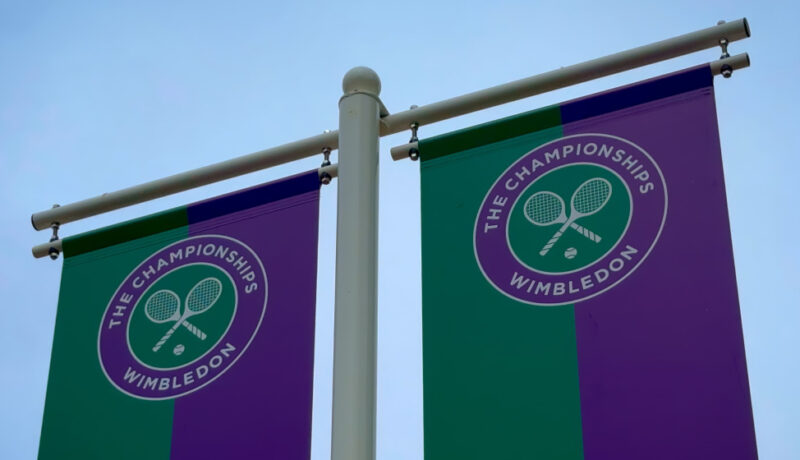
Whether you’re heading to the courts of Wimbledon or the grandstands of Silverstone, travelling for UK sport can be as memorable as the event itself. Here’s our guide to the best UK sporting events this summer and tips on how to get there.